Set the Min/Max of Chart Axes
Adjust the minimum and maximum values shown on chart axes.
In mySidewalk, chart axes auto-adjust based on the data values shown in the chart. You may want to adjust the axes, like setting the axis minimum to 0, for example.
This setting can be adjusted on
- Time Series,
- Bar Charts, and
- Correlations.
Change the y-axis on time series and bar charts
To alter the Y-axis with Time Series and Bar Charts:
- Within the report editor, add a Time Series or Bar Chart visualization.
- Choose your data indicator(s) and geography setting.
- Select the Style tab in the Settings pane on the right.
- Enter a custom Min or Max value for your Y-axis.
.gif)
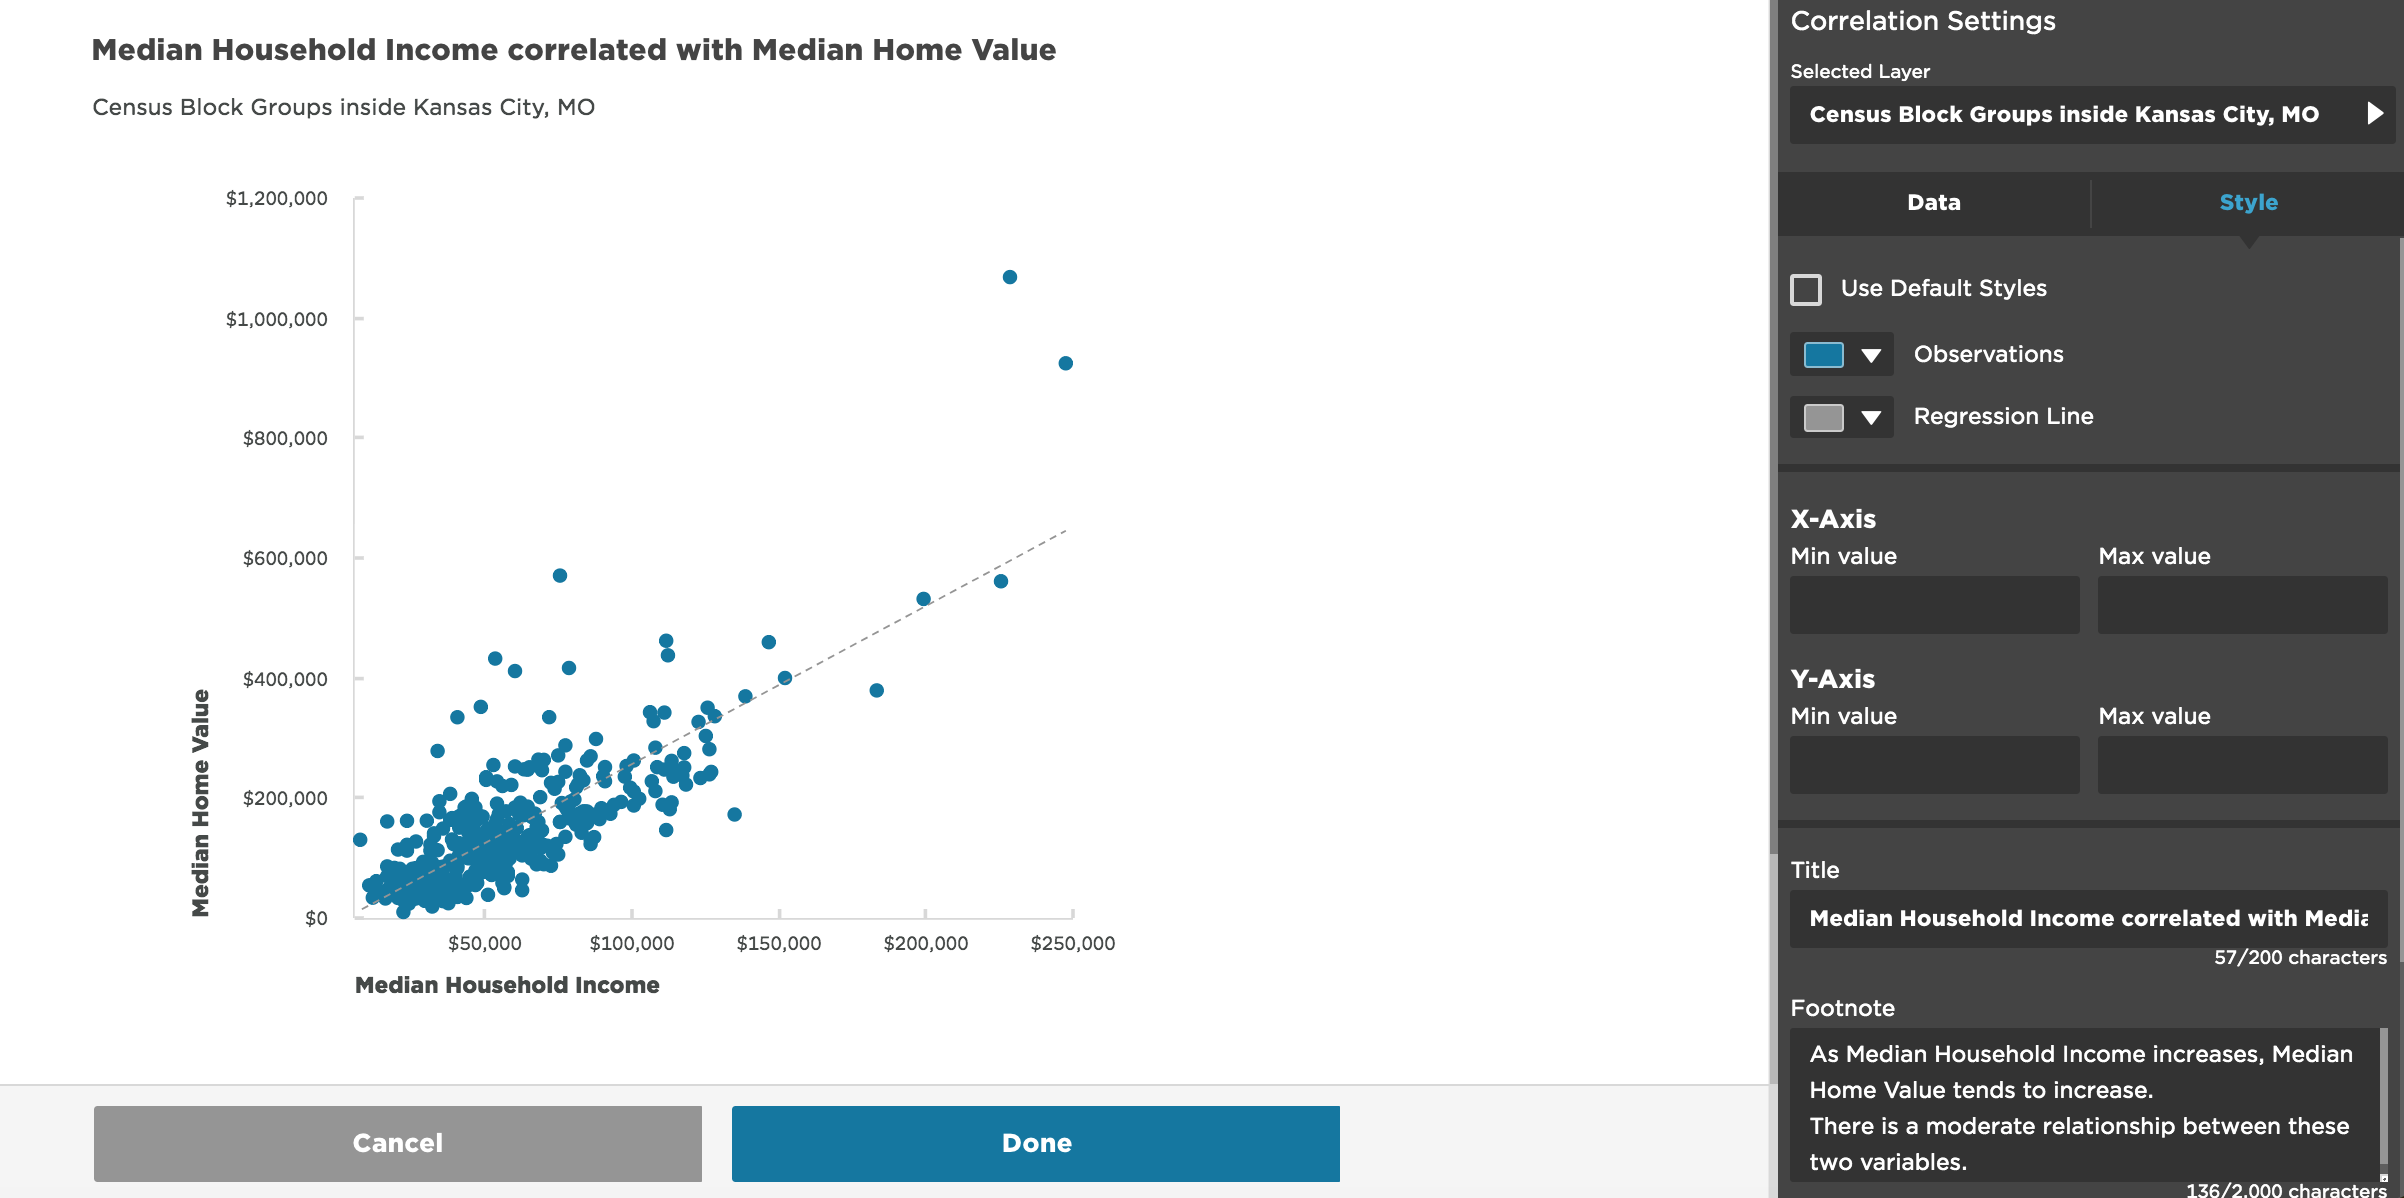
Change the x-axis and y-axis on correlations
To alter both the X-axis and the Y-axis with Correlation components:
- Within the report editor, add a Correlation visualization.
- Choose your data indicator(s) and geography setting.
- Select the Style tab in the Settings pane on the right.
- Enter a custom Min or Max value for your Y-axis.
