Embed mySidewalk Elements on Another Website
Use embed links to share mySidewalk visualizations outside of dashboards and reports.
Every graph, image and chart in your boards or report(s) is special. You'll likely want to share them with people and places outside of your mySidewalk dashboard. By embedding a mySidewalk visual on another website, you can share personalized insights and valuable data points with audiences that may not have a direct route to your mySidewalk report.
If you want to embed a specific element, you will need to publish your report or board and enable embedding.
Step 1: Enable embedding
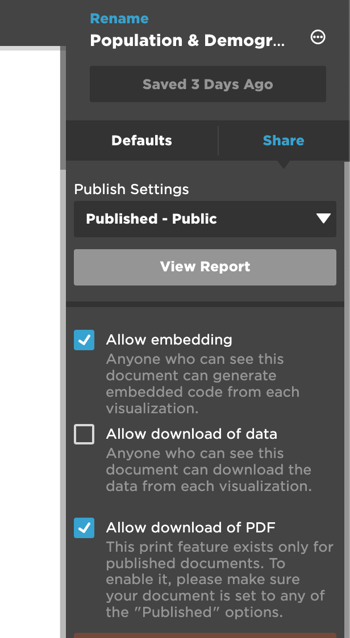
- While editing your report or board, look at the "Share" tab in the panel on the right side.
- In the "Publish Settings" drop down menu, ensure the board option selected is "Published-Public."
- Click the blue checkbox below the Publish Settings to "Allow embedding"

Step 2: Using the embed
- To use the embedded information, first go to the published version of your board or report. The easiest way to do this is to click the "View" button at the top of your asset.
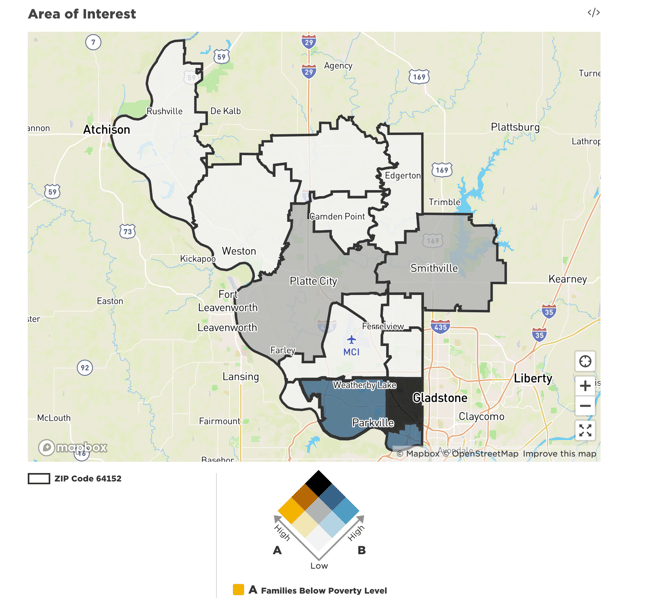
- Click the "Embed" button in the upper right corner of the desired visualization.

- This will bring up the embed code that you can copy and paste into your other website page.
- You can use normal HTML edits to adjust padding or the size of the viewing window for your embedded image or graphic.

Note: Your component needs to be published to see the visual through the iframe. However, you do not need to keep "Allow Embed" turned on if you do not want it on for everyone.