The mySidewalk Home page centralizes access to the most critical tools for your data storytelling workflow. From here, you’re just one click away from finding the data you need, discovering valuable insights, and telling your community’s story.
There are four main sections on the homepage:
- Get data about your community
- Explore insights
- Tell a story
- Left sidebar
The top: Get data about your community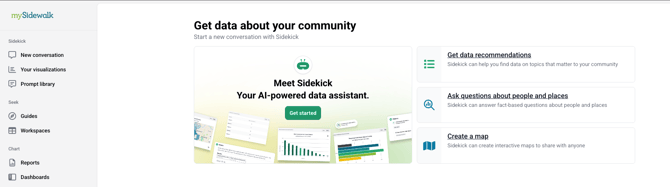
This section helps you get answers to your most burning questions - and data recommendation or visualization needs - quickly.
- Go straight to Sidekick, your AI-powered data assistant, or use the prompt suggestions on the right to get you started.
The middle: Explore insights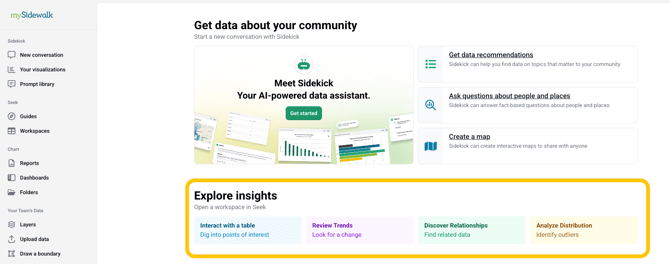
This section allows you to view interactive visualizations, interpret your data, and discover actionable insights.
- Explore a Map: Opens an interactive map to help you identify and understand spatial patterns.
- Review Trends: Opens trend graphs for up to 100 regions and allows you to calculate changes over time.
- Discover Relationships: Opens a correlation matrix to reveal the strength of relationships between selected variables.
-
Analyze Distribution: Shows how selected regions rank and the distribution shape of data across those regions.
Note: You must have regions and data selected before viewing visualizations. If not, you will be prompted to do so.
The bottom: Tell a story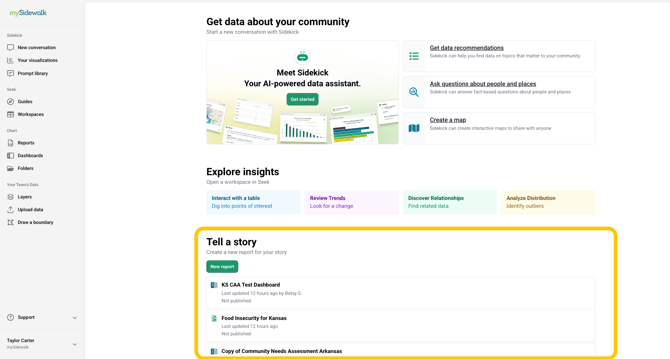
This section provides tools for telling your data stories.
- New report: Create a blank report where you can add content or select a report template.
- Pick up where you left off: Select from a list of recent reports and dashboards that you and your team have been working on.
The sidebar: Navigate across the platform
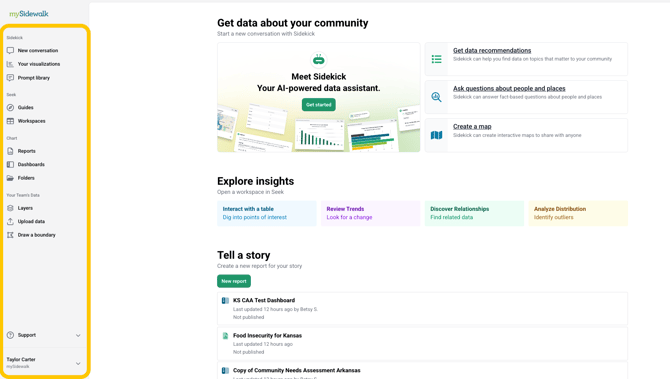
The sidebar offers quick access to core product areas and tools for managing your team's data.
- New conversation: Ask Sidekick a new question.
- Your visualizations: View, share, and save to reports or dashboards the visualizations you've created with Sidekick.
- Prompt library: Not sure how to word your request, or what's possible? Check out the promp library for help.
- Guides: Find curated data on topics your organization or partners care about.
- Workspaces: Select and organize data and regions by project.
- Reports: Create and share a report from scratch or a template, or edit existing reports.
- Dashboards: Create and share a dashboard, or edit an existing dashboard.
- Folders: Manage folders containing reports and dashboards.
- Your Team’s Data: Manage data layers your team has created or uploaded.
- Upload Data: Upload your own data to mySidewalk.
- Draw a Boundary: Create a custom boundary for your analysis and storytelling.
- Support: Find mySidewalk Academy, the Help Center, live chat, and more resources here.
- Your name: Find options to change your account's settings or view the list of accounts with access to your organization.