NPPES NPI data provides a detailed look at health care providers across the U.S., representing specialties from primary care to mental health to highly specialized medical services. This dataset helps communities understand what medical services are available locally—and which may be lacking.
This article explains how mySidewalk builds, processes, and interprets this dataset so that analysts can confidently use it in their work.
The Raw Data
Each month, the National Plan and Provider Enumeration System (NPPES) updates its registry of every medical professional and institution in the country. Each provider appears once in the registry and is identified by a unique National Provider Identifier (NPI).
Holding an NPI is required for billing medical services—effectively making it a prerequisite for practicing medicine in the U.S. Providers must update their NPI record whenever relevant details change (e.g., new credentials, new practice location). As of October 2025, the registry contains more than seven million records.
The dataset includes detailed information such as provider names, gender, primary practice locations, organizational affiliations, and whether their practice is active. Most importantly, it includes each provider’s Healthcare Provider Taxonomy Codes—the codes that classify areas of medical practice.
Providers can list up to 15 taxonomy codes, meaning a single doctor may list themselves as a primary care physician, pediatrician, and phlebotomist, all in the same record. This “one provider, many specialties” structure is essential to how mySidewalk processes and interprets this data.
How mySidewalk Builds the Data
1. Bulk Download and Normalization
mySidewalk begins by downloading the full NPPES dataset each month and loading it into a working database. Before any analysis occurs, address fields are standardized to ensure consistency. This normalization step is critical for accurate geocoding.
2. Geocoding Provider Locations
mySidewalk uses Geocod.io to convert provider addresses into XY-coordinate pairs. With cleaned addresses, we can reliably determine where each provider is located on a map.
3. Counting Providers Inside Geographic Boundaries
Once providers are geocoded, mySidewalk counts how many point locations fall within each geography—counties, ZIP codes, census tracts, and so on. For example:
-
X NPIs fall inside Fulton County, GA
-
Y NPIs fall inside ZIP code 30004
-
…and similarly for every geography available in our platform
This process—geocoding points and counting them within polygons—is standard for many datasets mySidewalk produces. But with NPPES NPI data, the meaning of “what we’re counting” requires additional context.
Interpreting NPPES NPI Data
At a high level, what you are seeing when you view NPPES NPI data in mySidewalk is a count of NPIs matching the criteria of the indicator.
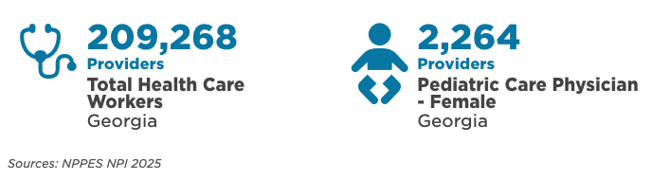
These values are literal counts based on the taxonomy codes providers list in their NPI record. Now, let's take a look at another example. But, because providers may list up to 15 specialties, a single provider can—and often does—appear in multiple indicators. Consider this example:
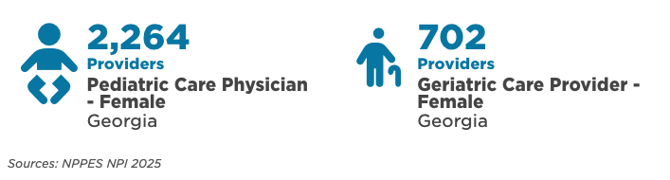
Some providers appear in both categories. Each indicator is accurate on its own, but the dataset does not tell us how many unique providers appear across multiple specialties.
Given this pattern, users sometimes notice unexpectedly high counts for niche specialties, especially in rural areas. This happens because:
-
The NPPES does not verify that a provider is currently credentialed or actively billing for all taxonomy codes they list.
-
Providers may list specialties they can bill for, even if they do not frequently perform those services.
Because of these constraints, mySidewalk cannot further refine or validate specialty-specific counts beyond what NPPES provides.
Let's take a look at a more granular example to drive the point home. Let's say Tract 116.40 in Alpharetta, GA has four doctors in it.
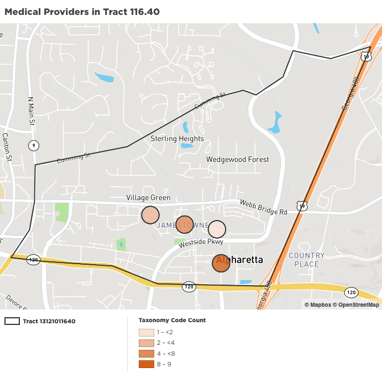
Let's dig into what our hypothetical doctors do:
| Doctor Name | Taxonomy Code Count |
Taxonomy Code Descriptions
|
| Salk | 1 |
Primary Care Physician
|
| Pasteur | 4 |
Primary Care Physician, Clinical Social Worker, Mental Health Provider, OBGYN
|
| Fleming | 8 |
Primary Care Physician, Midwife, Geriatric Care, Pediatrician, Clinical Social Worker, Dentist, Child/Adolescent Psychiatrist, Optometrist
|
| Snow | 2 |
Primary Care Physician, Optometrist
|
In this (however unlikely) scenario, mySidewalk would count the following for Tract 116.40:
- 4 total healthcare providers,
- 4 providers of Primary Care,
- 2 providers of Clinical Social Work,
- 2 providers of optometry,
- 1 provider of mental health care,
- 1 provider of dentistry,
And so on. If you added up all of the services being provided, you might be misled into thinking there are 15 providers (1+4+8+2) of various services in Tract 116.40, when in fact there are only 4. In reality, there are four providers of fifteen different kinds of care. This distinction is critical to understanding the NPPES NPI data set in mySidewalk.
Summary and Best Practices
NPPES NPI data reveals the range of medical services available in a community. However, because providers can list multiple specialties, it is difficult to determine the unique number of practitioners performing any single specialty.
A provider may be a general practitioner, an orthopedic specialist, and an OBGYN—all at once. Each of those services is part of the provider’s potential impact on the community, and mySidewalk’s data reflects that breadth.
When interpreting specialty-specific indicators:
DO:
-
Say “There are X providers offering obstetric services.”
-
Normalize counts as “X% of health care workers offer obstetric services.”
DON’T:
-
Say “There are X OBGYNs,” implying uniqueness.
-
Say “X% of providers are OBGYNs.”
-
Compare counts across specialties as though the provider groups are mutually exclusive.
Understanding these nuances ensures accurate, responsible interpretation of this rich dataset.