When you’re working with geographic data, maps can help reveal patterns and tell a story. Some common patterns are:
-
Clusters,
-
Islands,
-
Alignment, and
-
Division.
Here's how to identify them on a map.
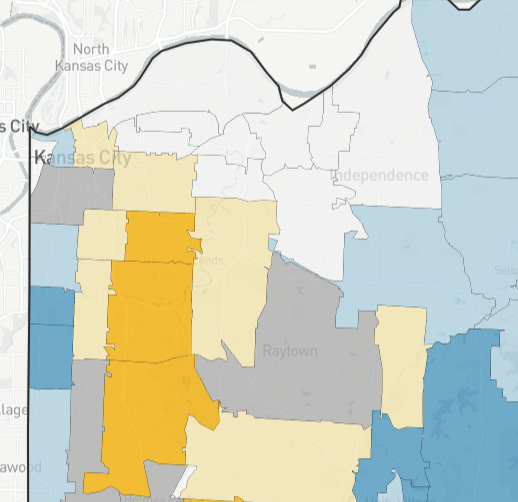
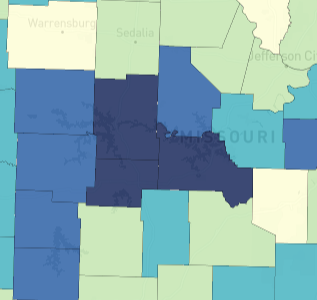
Finding clusters on a map
Clusters are groups of neighboring geographies with similar measurements.
- How to spot clusters: Look for a group of areas on the map with similar data points.
- What clusters can reveal:
- Population enclaves with similar experiences
- Populations that are being exposed to similar conditions, such as a high concentration of opportunity or disadvantage
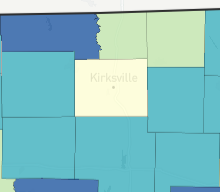
Identifying islands on a map
Islands, or spatial outliers, are areas that don't fit the pattern within a cluster.
- How to spot islands: Look for geographies within a cluster that have noticeably different measurements.
- What islands can reveal:
- Islands can highlight the presence of unique circumstances or factors affecting a specific area.
- Using more data, your local knowledge, or community outreach, you can build an idea of what conditions may be different there.
Alignment of two variables on a bivariate map
Alignment occurs when two variables follow similar spatial patterns.
- How to spot alignment: Look for neutral colors that show up in the center of a bivariate map legend.
-
On the yellow – blue scale, look for shades of gray.
-
On the magenta – green scale, look for shades of purple.
-
- What alignment can reveal: Alignment helps show how two factors, like income and access to transit, relate across areas within a community.
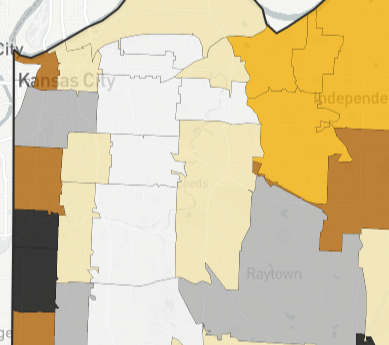
Division of two variables on a map
Division shows stark contrasts between geographies based on two variables.
- How to spot division: Look for areas where strong colors represent extremes in a bivariate map.
- For the yellow – blue scale, look for strong yellows or blues.
- For the magenta – green scale, look for strong magentas or greens.
- What division can reveal: Division tells a story of how different parts of a region may have been shaped by historical or social factors.