![mySidewalk_Logo_2_Color-2.png]](https://help.mysidewalk.com/hs-fs/hubfs/mySidewalk_Logo_2_Color-2.png?height=40&name=mySidewalk_Logo_2_Color-2.png)
Tree Canopy Data Is Here — From Your State Down to Your Block Groups
Where is tree cover sparse in your community, and how is it changing?
New tree canopy data from the USDA U.S. Forest Service (USFS) is now available in mySidewalk, yearly from 2020 through 2025. The Forest Service publishes it as 30-meter satellite imagery. We've summarized it into 15 levels of geography, from states and counties down to neighborhoods, city council districts, census tracts, and block groups.
What's new
-
Average tree canopy coverage — the average percent of ground covered by tree canopy
-
Median tree canopy coverage — the midpoint, useful for spotting uneven cover (see below)
-
Tree canopy coverage by range — the acres, and the share of total area, falling into 0–19%, 20–39%, 40–59%, 60–79%, and 80–100% canopy
Understanding average vs. median
When the average and median are about the same, tree cover is fairly even across the area. When the average is higher than the median, a few heavily wooded spots — a large park, say — are pulling the average up, and most of the area has sparser canopy.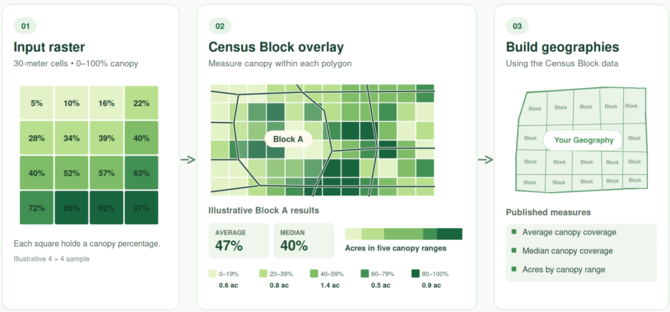
The Forest Service's 30-meter canopy readings are measured within each census block, then built up into every other geography level. A geography shows a value only when at least 90 percent of it is covered by the source data. In Alaska, the source covers only the southeastern panhandle, which is why there's no national figure.
Where you can use it
This data is available at every mySidewalk geography level except nation: state, county, metro and micropolitan area, metropolitan planning organization, congressional and state legislative districts, school district, county subdivision, place, city council district, ZIP code, neighborhood, census tract, and census block group. It can't be apportioned to custom geographies.
Put it to work with Sidekick
Ask Sidekick about your community — the same way you'd ask a colleague:
-
How is tree canopy distributed across [your city]?
-
Which parts of [your city] have seen the most change in tree canopy since 2020?
-
Which neighborhoods in [your city] have the least tree cover, and who lives there?
-
Which similar cities have tree canopy coverage like [your city]'s?
-
Where in [your city] is canopy concentrated in a few spots, and where is it spread evenly?
-
Which parts of [your city] face the greatest exposure during extreme heat, and where should a tree planting effort start?
-
Draft a one-page briefing on tree canopy in [your city] for our parks board.
Whether you're building a heat resilience plan, a tree planting strategy, or the case for greening investments, the data is ready when you are.
Log in and explore the tree canopy data →