![mySidewalk_Logo_2_Color-2.png]](https://help.mysidewalk.com/hs-fs/hubfs/mySidewalk_Logo_2_Color-2.png?height=40&name=mySidewalk_Logo_2_Color-2.png)
This feature is available to Builder Pro customers. If you have questions about your subscription, contact your customer success manager email support@mysidewalk.com.
Before you begin
This guide starts with a dataset already available in a Sidekick project. Go here for information on how to get your data processed by mySidewalk.
1. Open your project.
Select Projects in the left navigation, then open the project containing the dataset you want to explore. It will be under Datasets on the right side of the page. On the Sidekick tab, select Ask in the message box.
2. Attach a dataset to your question.
Click the paperclip in the message box and select Choose from project. Check the dataset(s) you want to use, then click Add file.
Here is a quick walk-through of how to access and use your data.
3. Start by learning what's in the data.
If you're unsure where to begin, try:
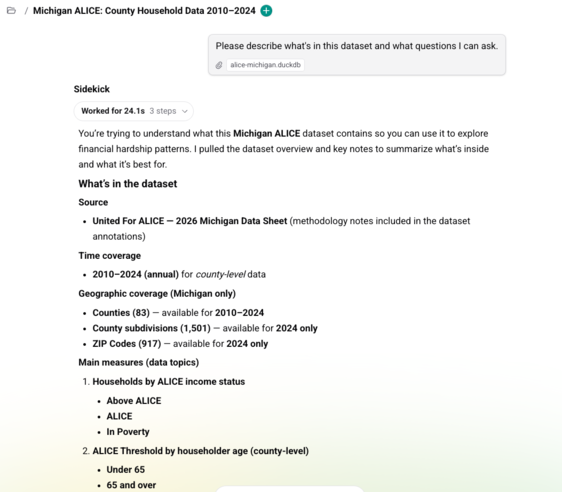
Please describe what's in this dataset and what questions I can ask.
Click the up arrow to send your message. Sidekick will review the dataset and respond with an overview and suggested questions.
Use that overview to understand what the data measures, which places and time periods it covers, and which questions you want to explore next.
4. Ask a specific follow-up question.
Continue in the same conversation. Include the measure, location, and year when they matter to your question.
In our example, the next question is:
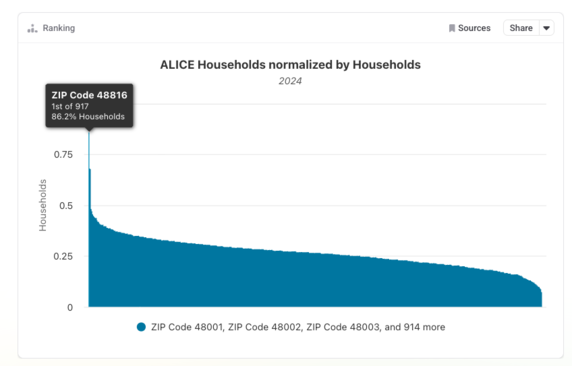
Which ZIP codes have the highest ALICE concentrations in 2024?
Sidekick returns a ranked answer and a chart. Check how it interprets your question: in this example, it uses ALICE households as a share of all households. If you want a count instead of a percentage, say so in your follow-up.
Adapt the question to your data. For example:
Which [geographies] have the highest [measure] in [year]?
5. Ask to see results on a map.
To explore geographic patterns, ask for a map in the same conversation.
This recording uses:
Map by county and ZIP.
Sidekick returns separate county and ZIP code maps. Hover over a location to see its value, and use the map controls to explore the area.
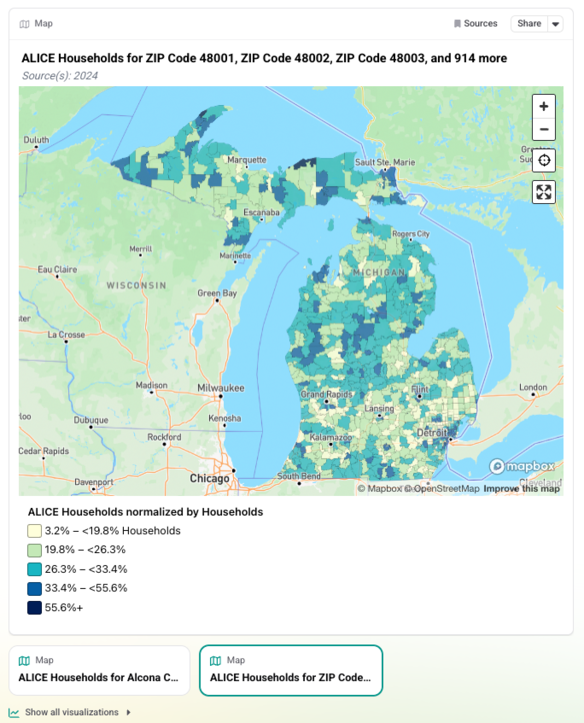
The maps you can request depend on the places and measures available in your data. Be specific about which measure and year you want to see if the conversation has covered several.
Keep the conversation going, then try Build.
Ask Sidekick to explain a result, narrow the analysis to a particular place, explore another question, or bring in mySidewalk data as community context. You can build on the previous answer without attaching the same dataset again in each message.
Or, ready to turn your exploration into a briefing, report, or other deliverable? Ask Sidekick to help you write a prompt for a new Build session.
Try:
Based on what we've explored, write a prompt that I can give to a new Sidekick Build session for a short briefing for our community partners.
Copy the prompt into a new Build session in the same project, attach your dataset, and use it as your starting point.
Before using a result in your work, review its measure, time period, geography, and source information. Your knowledge of the community helps you interpret what the numbers mean.