Seek Trends View
Use Seek Trends view to look at data over time and calculate change.
Getting started in the trends view
The Trends View is one of five available views in Seek. Other views include:
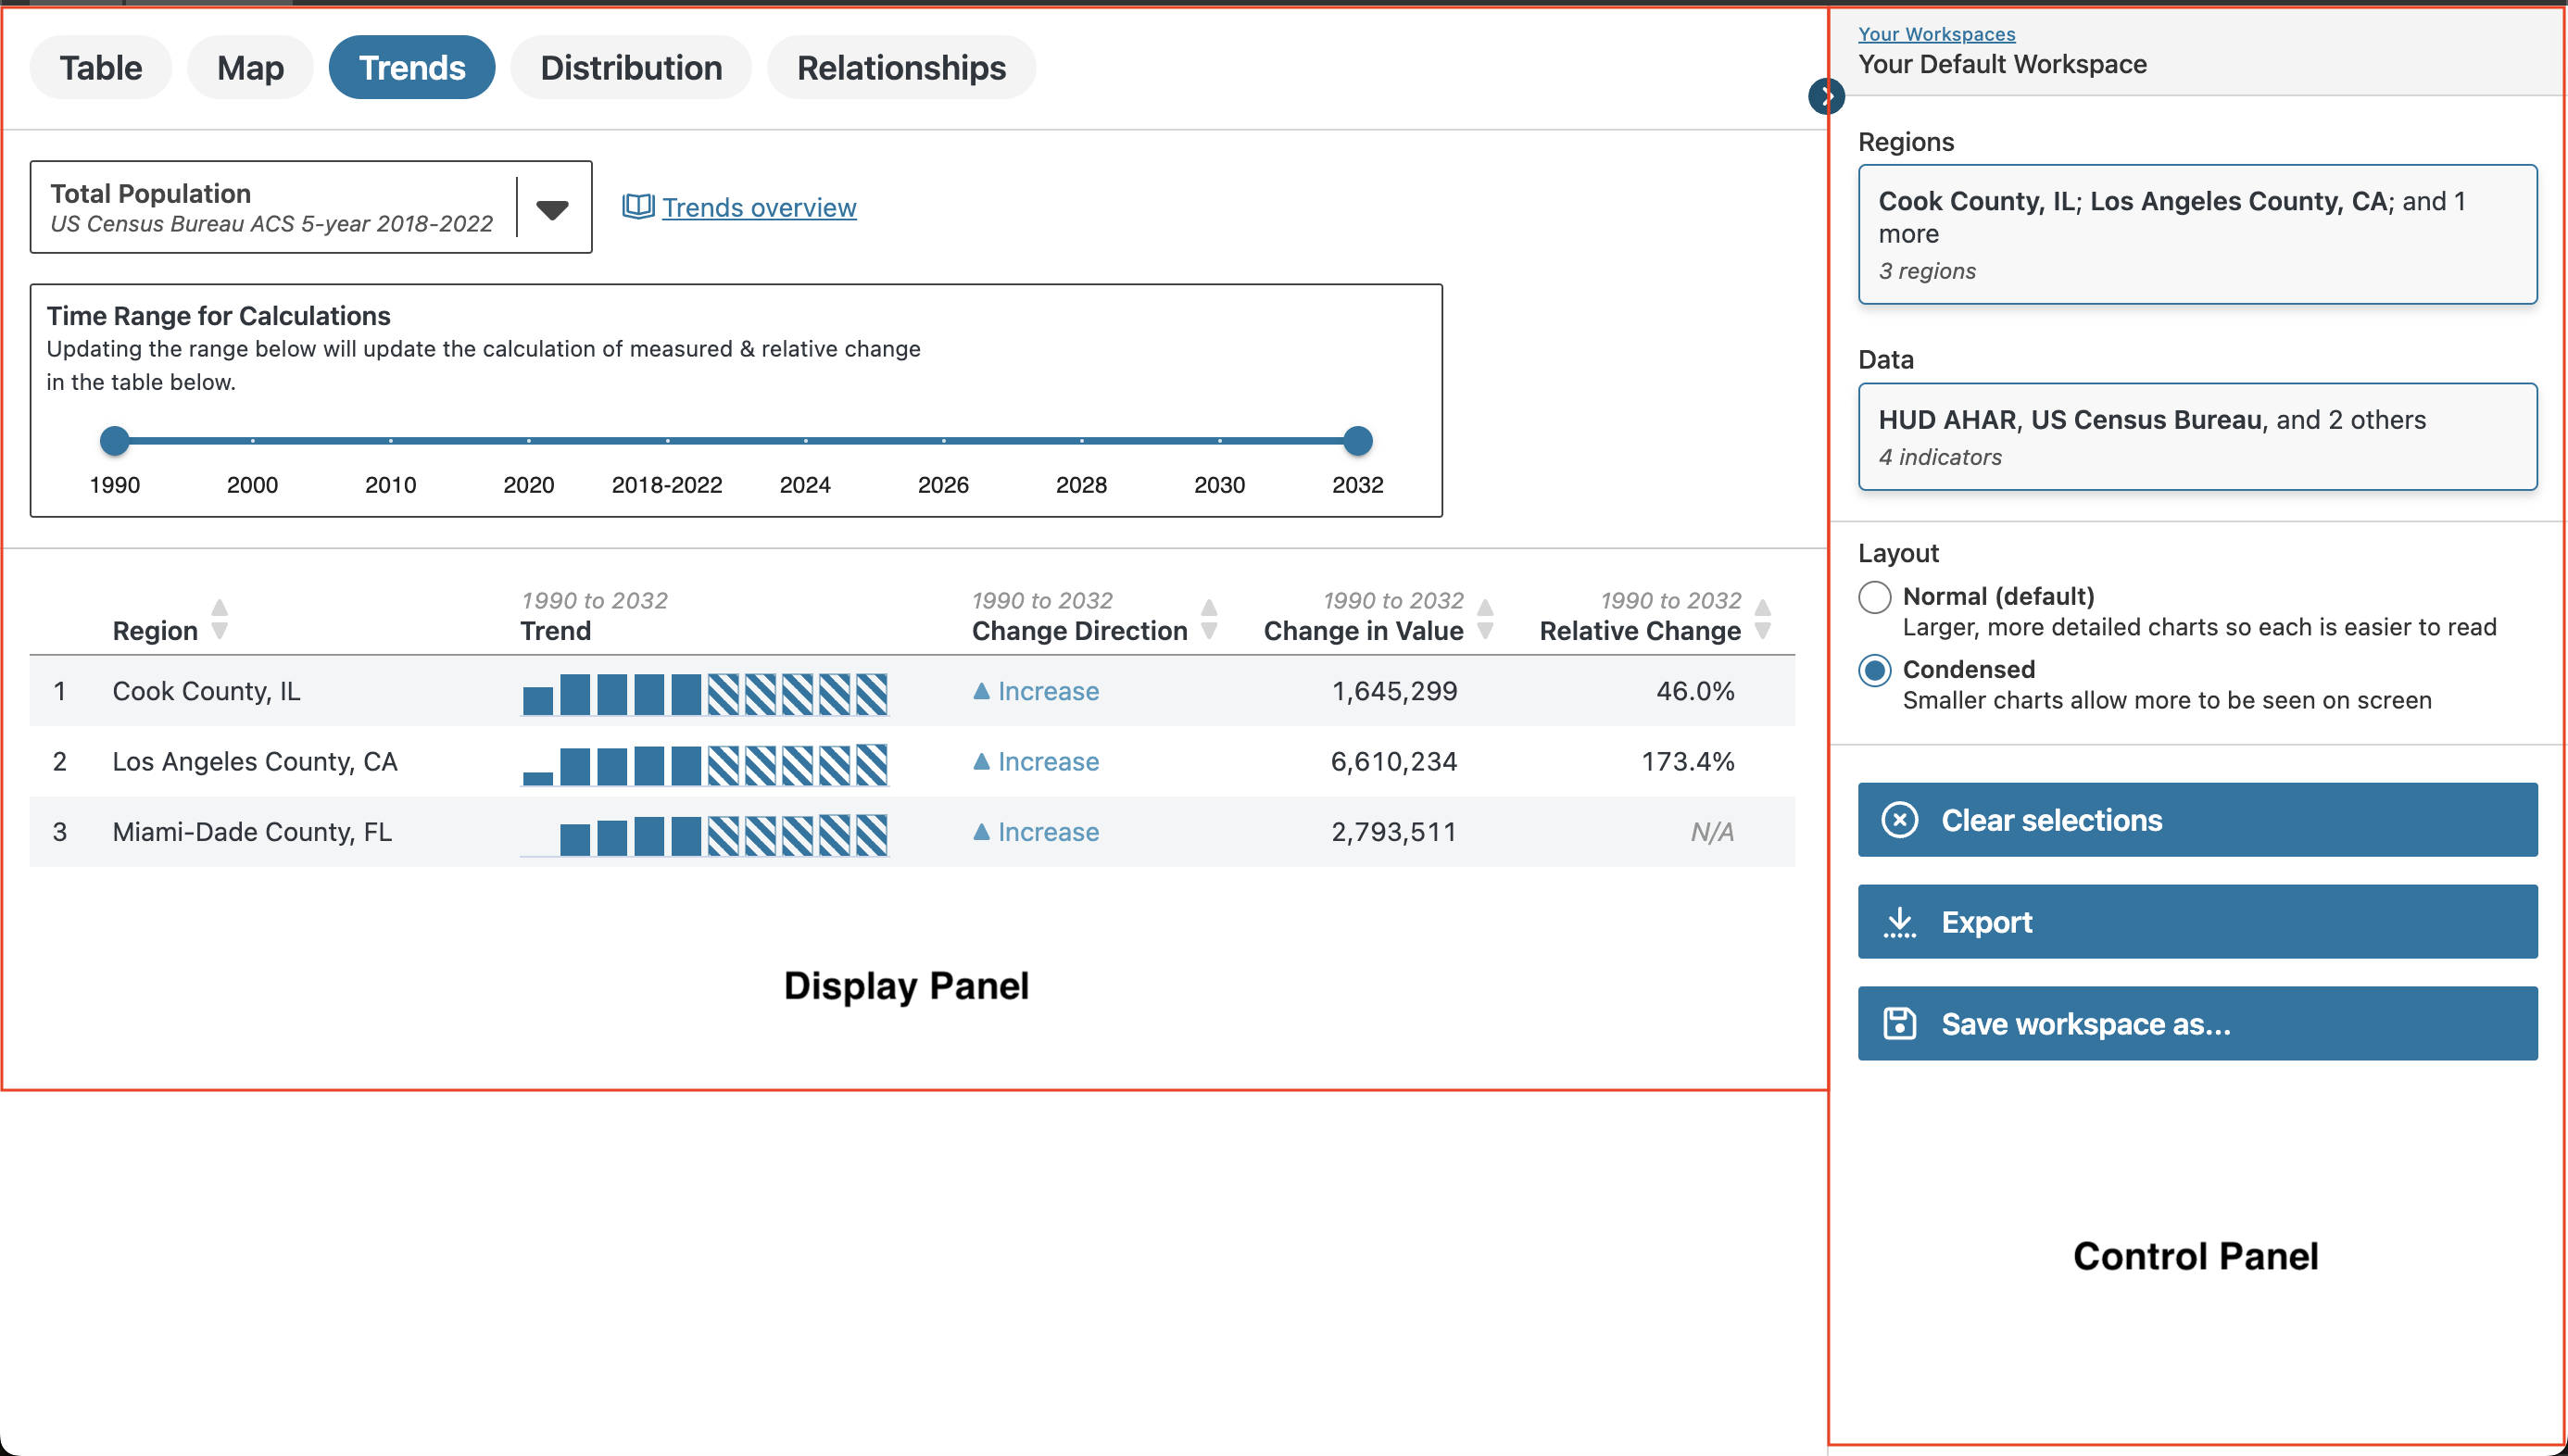
The layout consists of:
-
Display Panel: Located on the left, this shows your data values.
-
Control Panel: Located on the right, this allows you to select regions and data, determining what appears in the Display Panel.

Note: If you’ve already selected regions and data in another view, they will carry over to the Trends View. To change or add to your selections, return to the Regions and Data modals in the Control Panel.
What you can learn from the trends view
The Trends View in Seek allows you to explore how a community changes over time. With it, you can:
-
Compare changes across multiple regions at once.
-
Review data for dozens or even hundreds of places in one view.
How to use the trends view
The Trends View includes a table, which allows you to:
-
Review trends for up to 100 regions at once.
-
Calculate changes over a customizable time range.
Find the largest or smallest changes
-
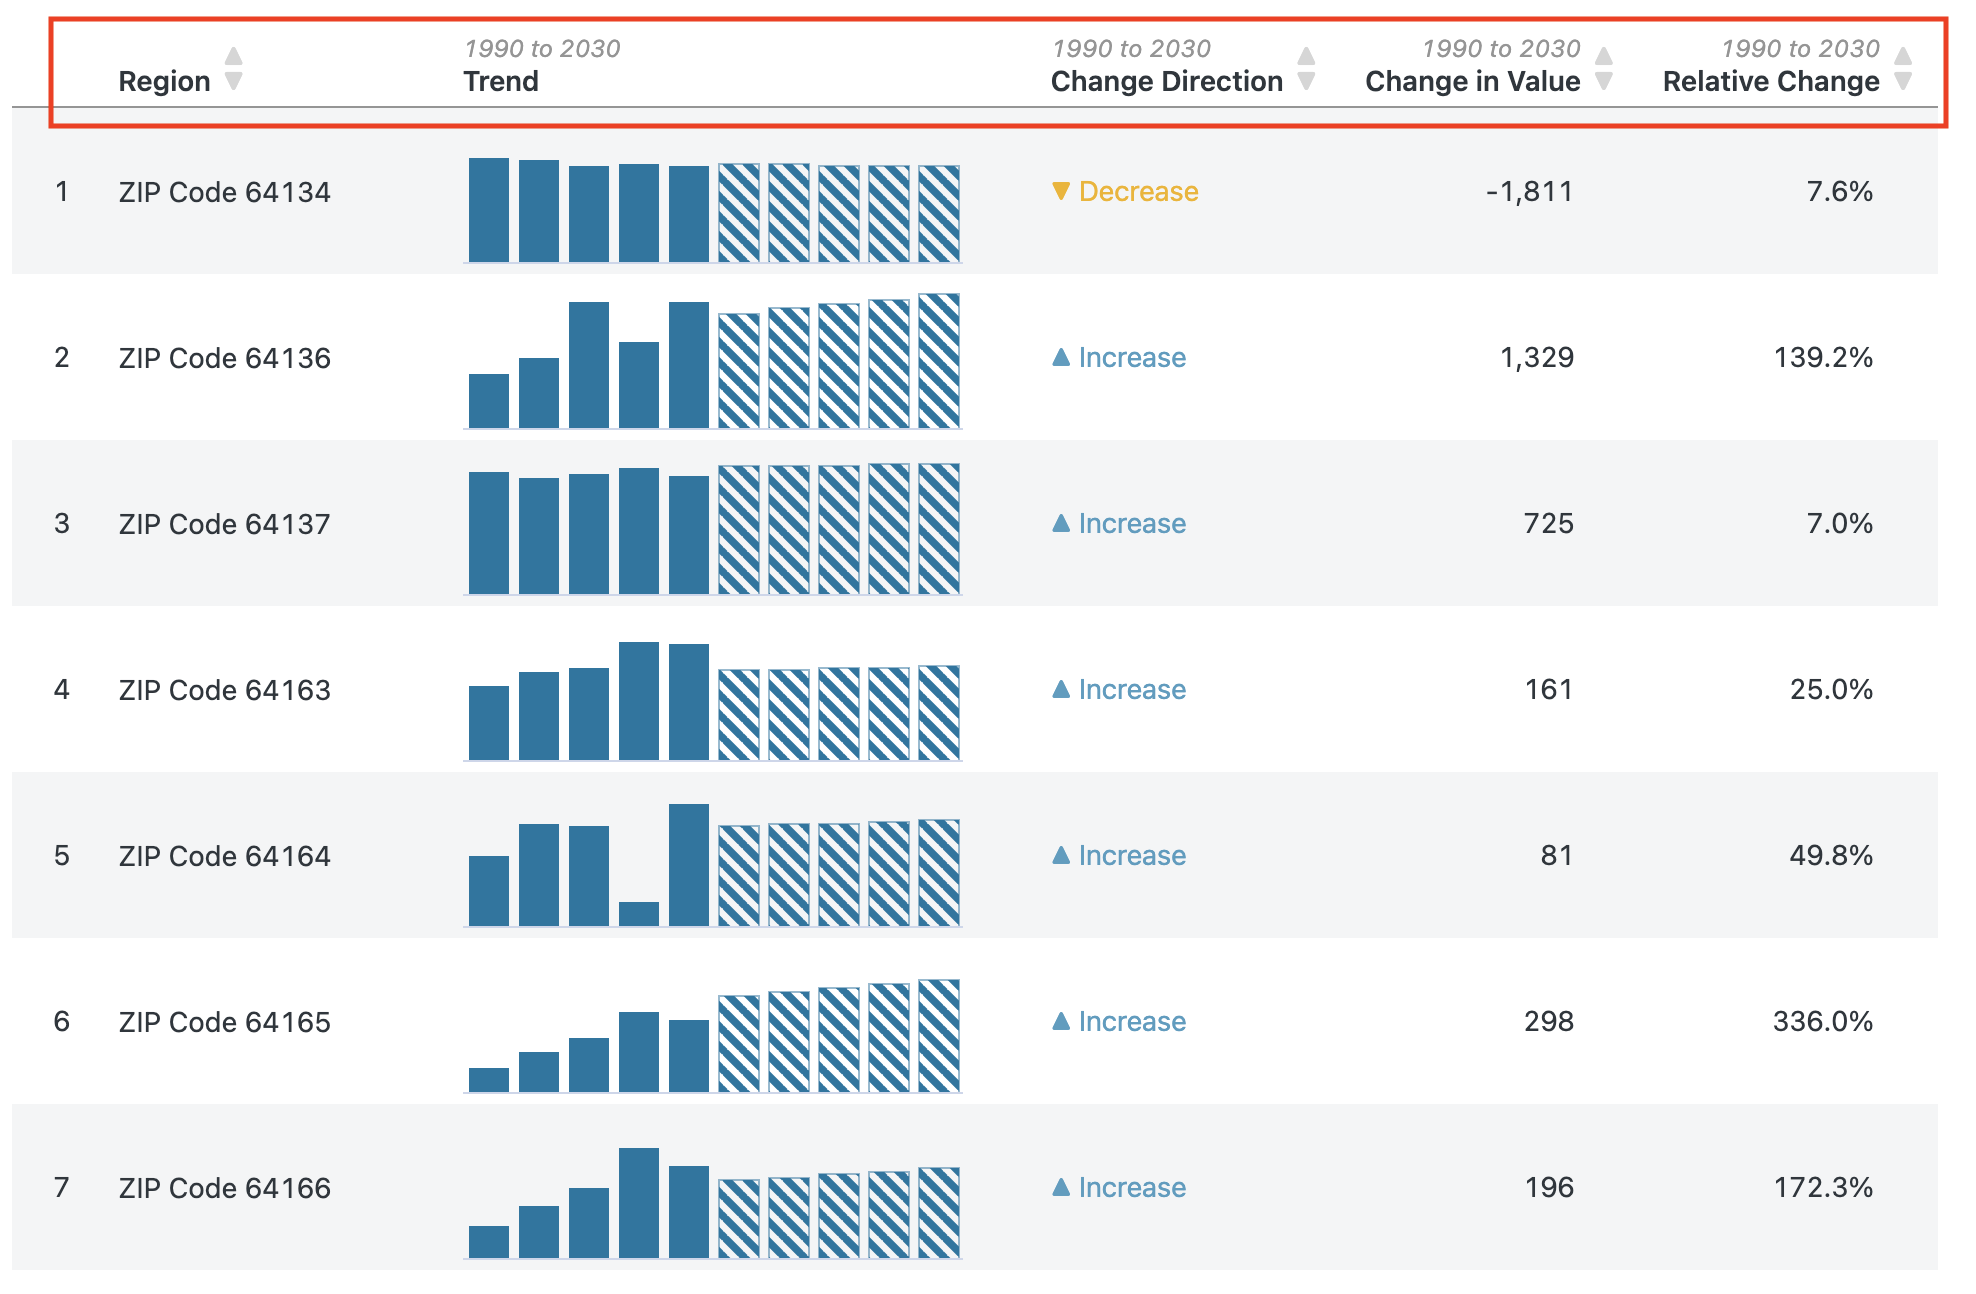
Sort the table by region, direction of change, measured change, or relative change.
-
Example: To sort by measured change, click on the Change in Value header.
-

Calculate the change between two points in time
- Use the range slider at the top of the screen to adjust the timeline.
- You can exclude projections or historic values by modifying the slider.
- Example: In the image below, the slider was moved to exclude projected data.

Explore an interesting trend
-
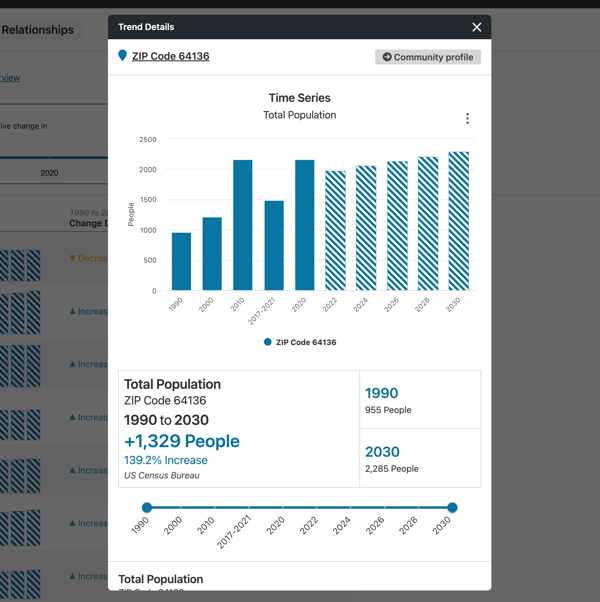
Click on any region’s name to open a detailed view with an interactive graph.


Export your findings
You can export the data in two ways using the Control Panel:
-
Export as PNG: To share a snapshot of the Trends table.
-
Export as CSV: For deeper analysis of all trend data in external tools like Excel.
