Download data and visualizations from a dashboard or report
Learn how to download and save data or visualizations from the mySidewalk platform for personal use or sharing.
How to enable this feature
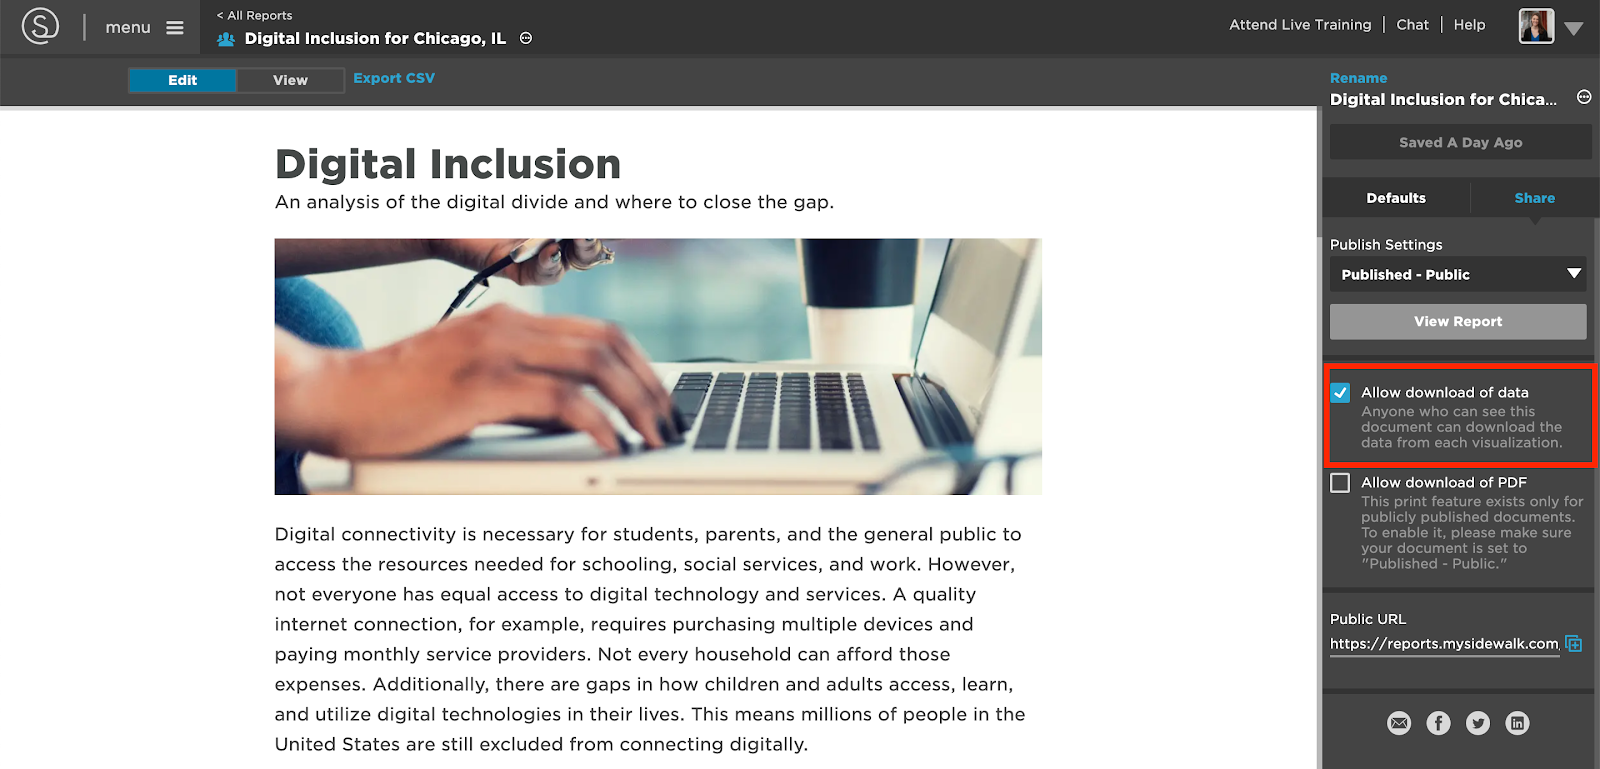
To allow visitors to download data from a dashboard or report:
- Navigate to app.mysidewalk.com and open the desired dashboard or report.
- Open the share settings located on the right-hand side.
- Check the box next to "Allow download of data." This will enable you and visitors to download data and visualizations from the shared dashboard.

Exporting
There are two types of files you can download:
- Data files
- Image files
Exporting data
Once the feature is enabled, viewers can download any displayed data:
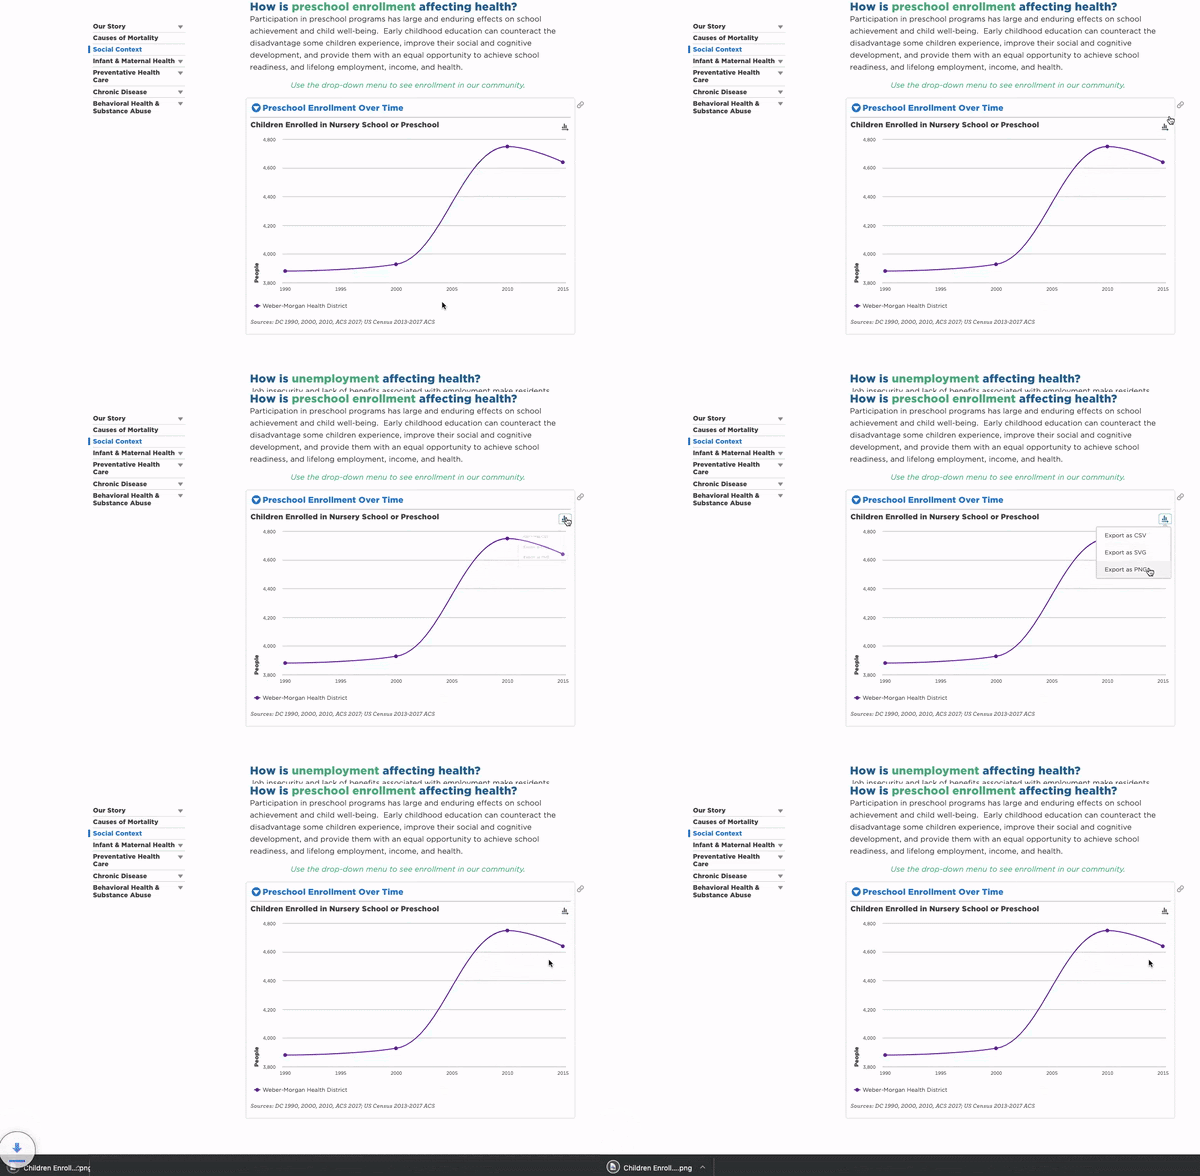
- Click on the icon (a small graph) in the top right corner of the data display.
-
Data will download as a
.csvfile or as ageoJSONfile if it’s a map.

Exporting images
To export visualizations (e.g., maps or graphs) as image files:
- Click the same icon next to the visualization you want to export.
- Choose to export as
PNGorSVG. (For more details on formats, visit the download formats article.) - Depending on the visualization, you may be able to select different sizes (small, medium, large).

Note: Image export is limited to maps, charts and graphs (i.e. map, pie chart, time series, bar graph and correlation).
Tip: If your download doesn’t start automatically, make sure your browser’s pop-up blocker allows pop-ups from the page.
How to download without publishing
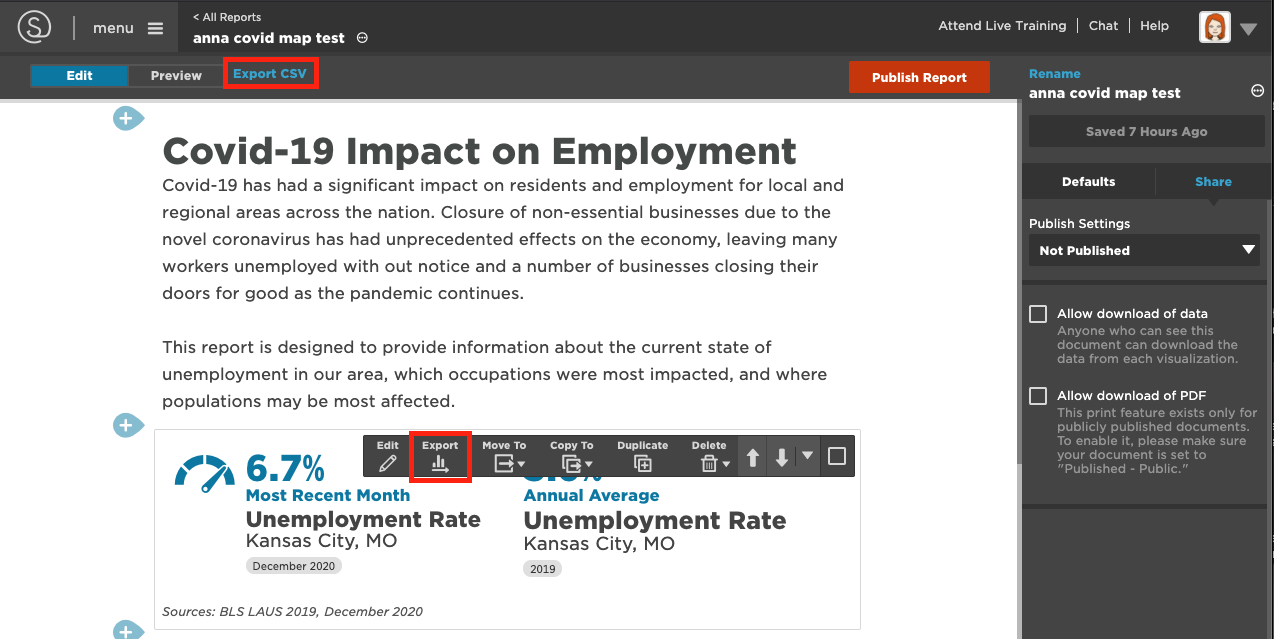
If the dashboard or report is not published, you can still download data.
For individual components:
- Hover your mouse over the desired component and click the export icon.
- Select "Export CSV" to download the data.
For whole reports:
- Click the Export CSV link under the title of your report.
Note: The "Export CSV" feature does not include visuals from collections, but you can export those by clicking "edit" on the collection and then exporting individual components.
