Differences Between Reports and Dashboards
Learn the difference between reports and dashboards to determine the best application for your needs.
mySidewalk provides two different formats for presenting information: Reports and Dashboards. While similar, they differ in functionality and organization.
Reports
- A report is a single page that focuses on one topic.
- Reports are designed to be succinct and persuasive.
- Reports can cover a single topic in-depth or several topics at a high level.
- Example report
Dashboards
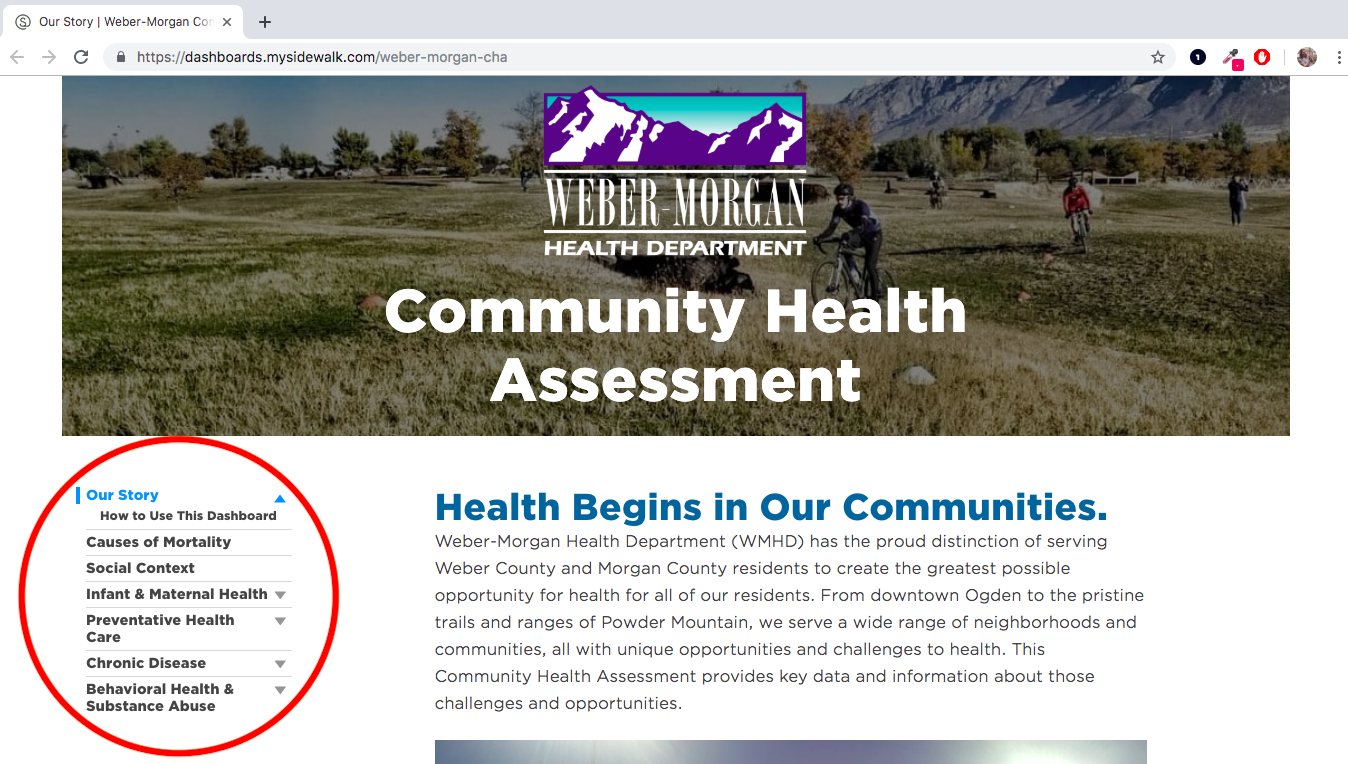
- A dashboard is a collection of multiple pages.
- Each page provides insights on specific topics that contribute to an overall story.
- Dashboards offer a broader picture and allow you to explore various elements in more depth.
- Example dashboard

How do reports and dashboards interact?
- You can create standalone reports or combine them into a dashboard. Dashboards provide more navigation flexibility for organizing multiple related reports.
- You can save individual dashboard pages as reports.